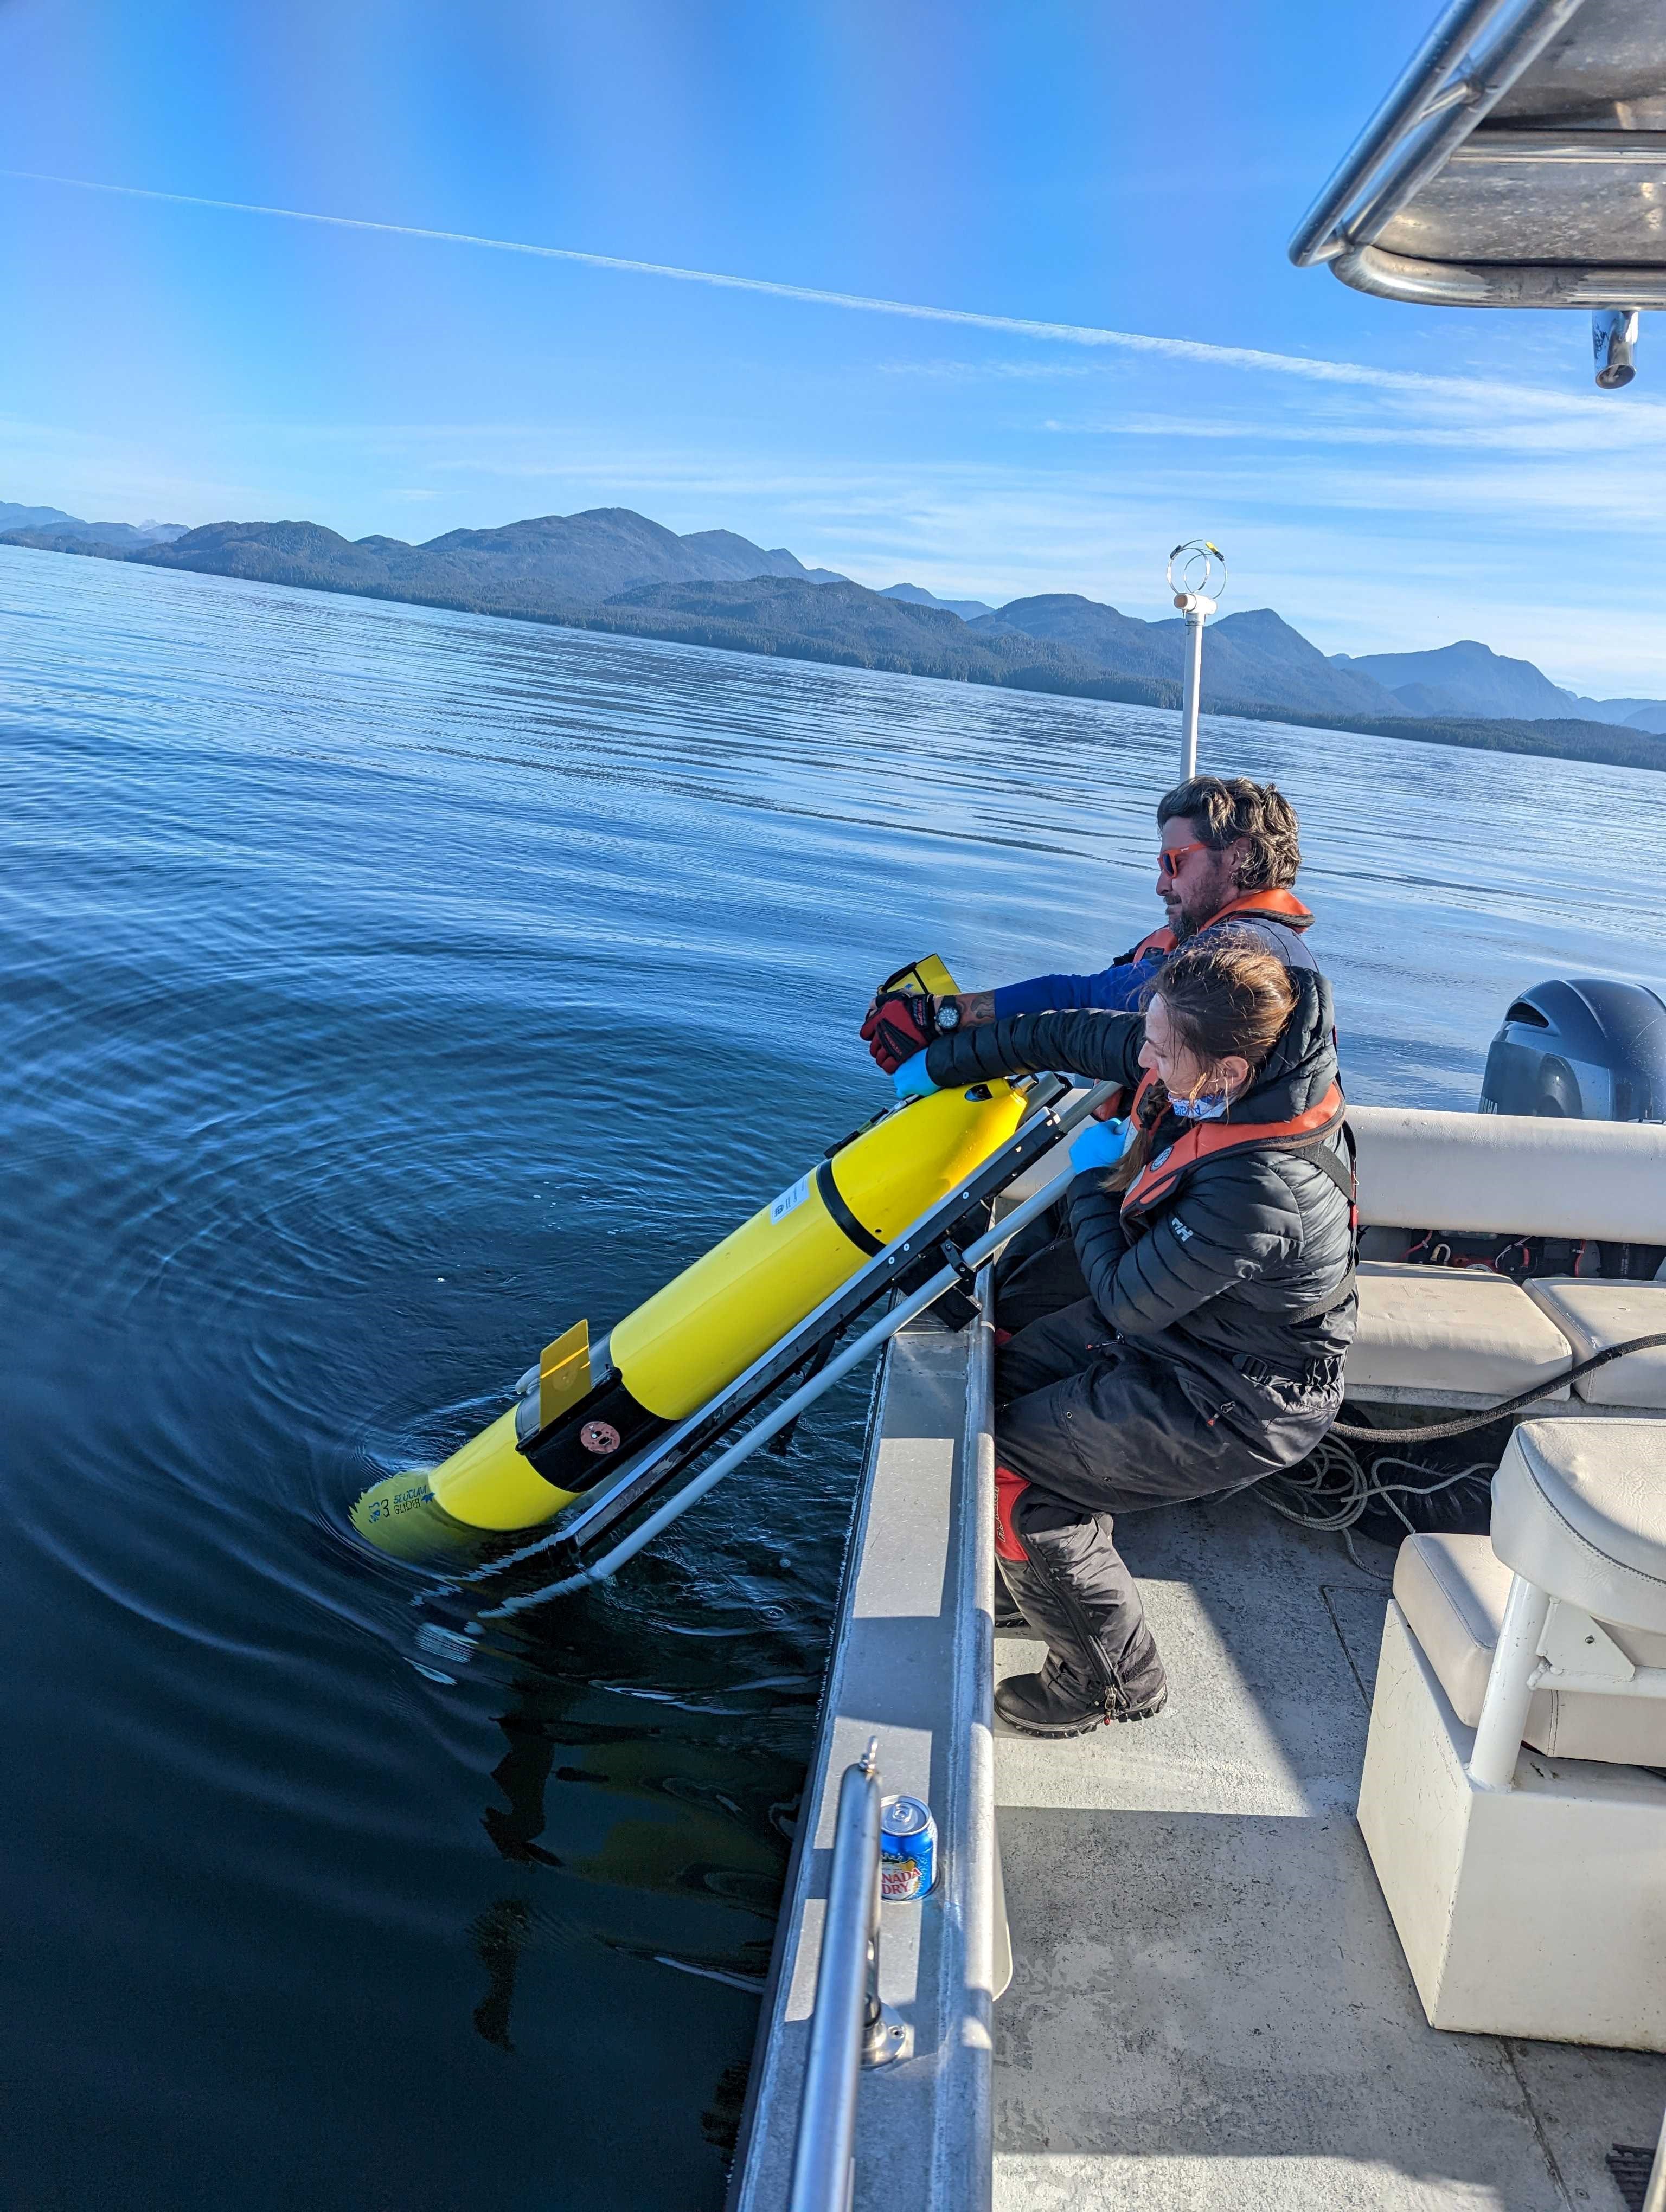
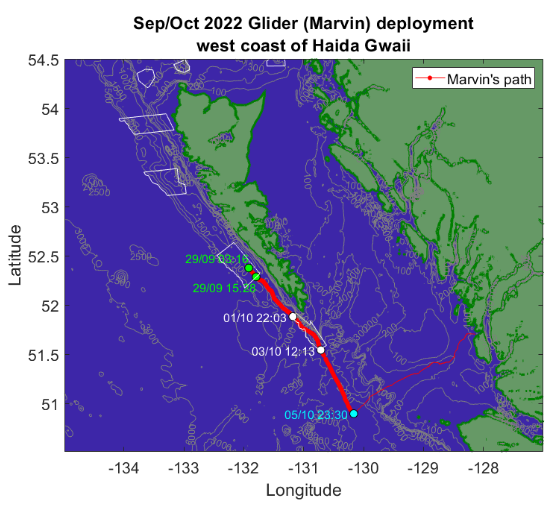
After being deployed as part of DFO’s Sharing Science at Sea Expedition, Marvin travelled down the west side of Haida Gwaii, passing through the two southern Haida Gwaii Network Areas of Interest (AOIs). Marvin then turned into Queen Charlotte Sound, passed up Goose Trough, and was recovered on Oct 13 at Calvert Island.
While on this journey, Marvin collected a beautiful section of oceanographic data along the shelf break. This map shows Marvin’s path, including the 2 AOIs (shown with white outlines) he passed through. The symbols and timestamps have been added to make it easier to distinguish data collected inside and outside the AOIs.
The following plot shows a section of temperature as observed by Marvin. The white lines show the isopycnals (or surfaces of constant density). The grey bumps along the bottom are the bottom depth based on GEBCO 2014 bathymetric data. The red stars show the depth that Marvin “saw” the bottom.
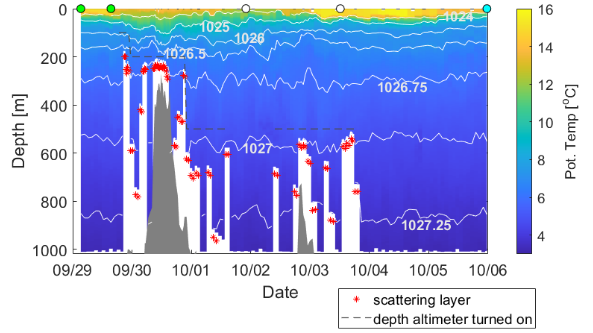
Marvin uses a 150-kHz acoustic depth sounder to determine if he’s close to the bottom, but can mistake a school of fish or zooplankton (i.e. a “scattering layer”) for the bottom, causing him to dive short. These are annoying from an oceanographic perspective (as we’d like to know what the water temperature/salinity/oxygen are underneath the scattering layer) but interesting from a food availability perspective, so the depth of the scattering layers that Marvin detected are highlighted for the interest of any marine biologists.
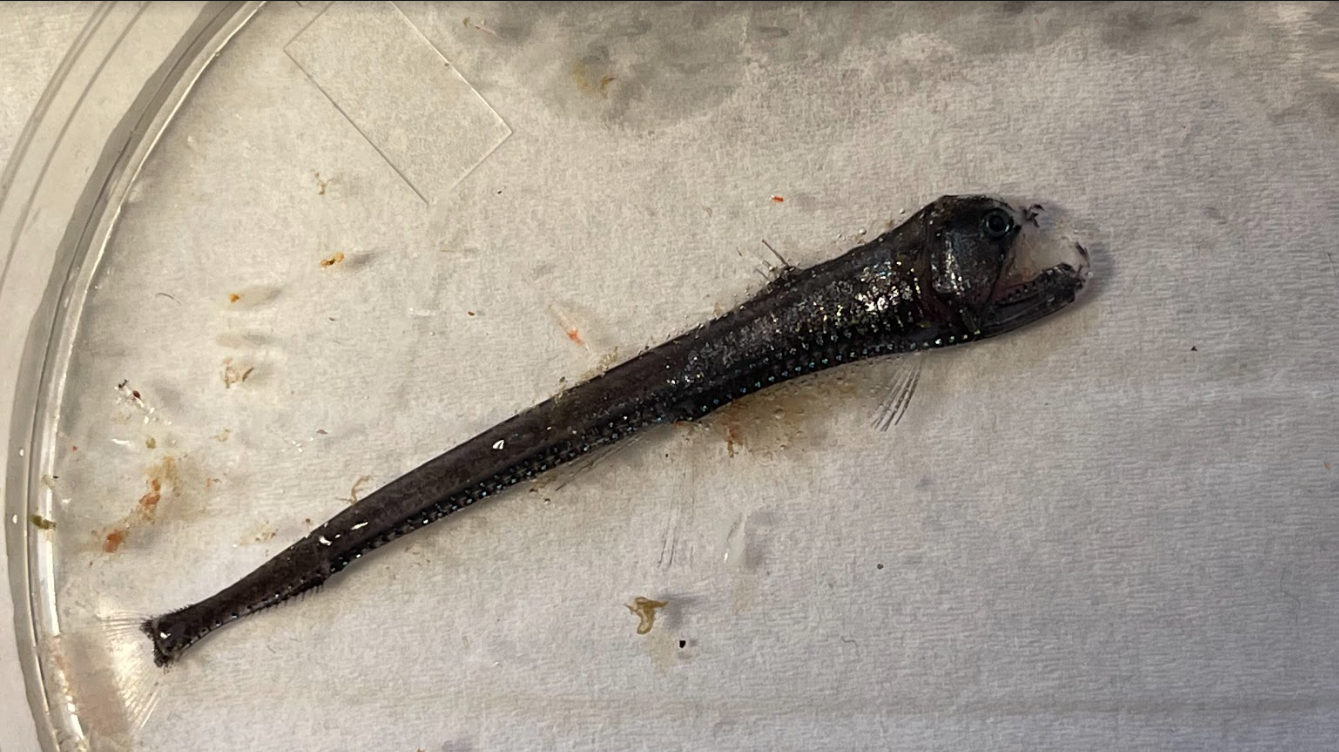
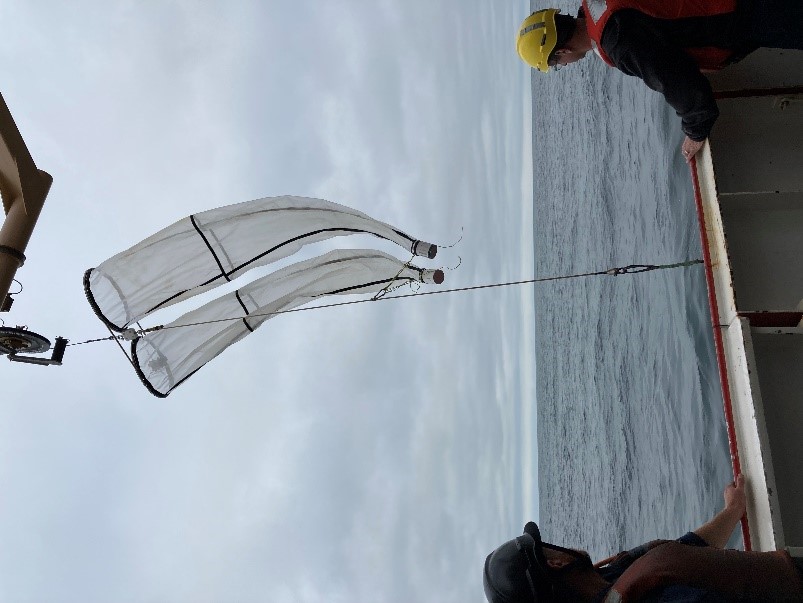
Marvin could be turning off viper fish layers - at least when we set him to turn on his altimeter (i.e. the depth sounder) only beneath 500 m (depth he turned his altimeter on is shown with the dashed line). Viper fish, like the one shown here, were found in every deep Bongo net tow done off the coast of Haida Gwaii from the ship that deployed Marvin.
This plot of Marvin’s oxygen data show that along the shelfbreak of Haida Gwaii, oxygen levels range from severely hypoxic (i.e. near zero, fish killing levels) at 1000 m, to fully saturated in the upper 10s of meters.
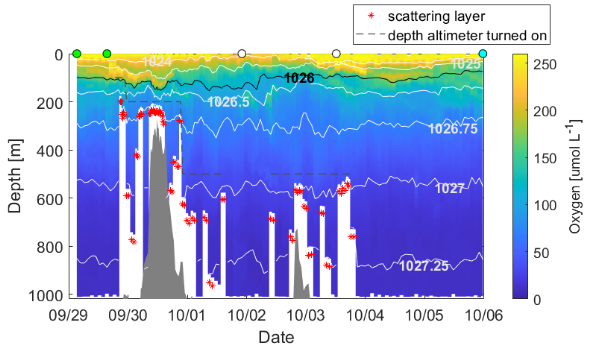
They also show what is probably the most interesting feature in Marvin’s Haida Gwaii data: an oxygen tendril. Starting just after Marvin left the first AOI (second green dot) there appears to be a layer, or tendril, of oxygen-saturated surface water sliding beneath less oxygenated water. The tendril reaches its deepest extent over the 300-m deep “sea-hill” (i.e. miniature seamount) that Marvin passed over, though it’s hard to tell from these data whether that is a simply coincidence of timing.
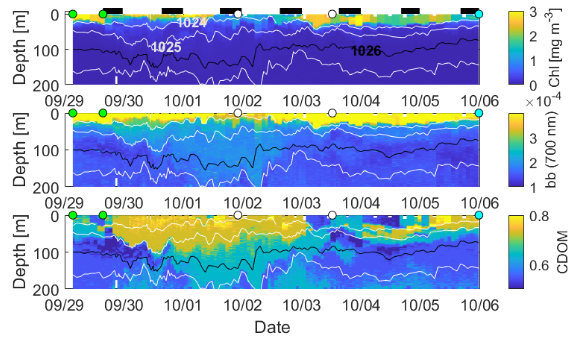
Marvin’s optical data collected at the same time (i.e. the chlorophyll fluorescence, optical backscatter at 700 nm and colored dissolved organic matter (CDOM) fluorescence shown above) show that this high-oxygen tendril was accompanied by a strong CDOM signal, suggesting a watermass containing particulates from land. Both chlorophyll fluorescence and backscatter are largely absent from the tendril, however, suggesting there are very few phytoplankton in that water – making local production of oxygen unlikely.