C-PROOF is seeing the first signs of El Niño in our underwater autonomous glider observations along the British Columbia coast, with temperatures as deep as 1000 m exceeding normal values.
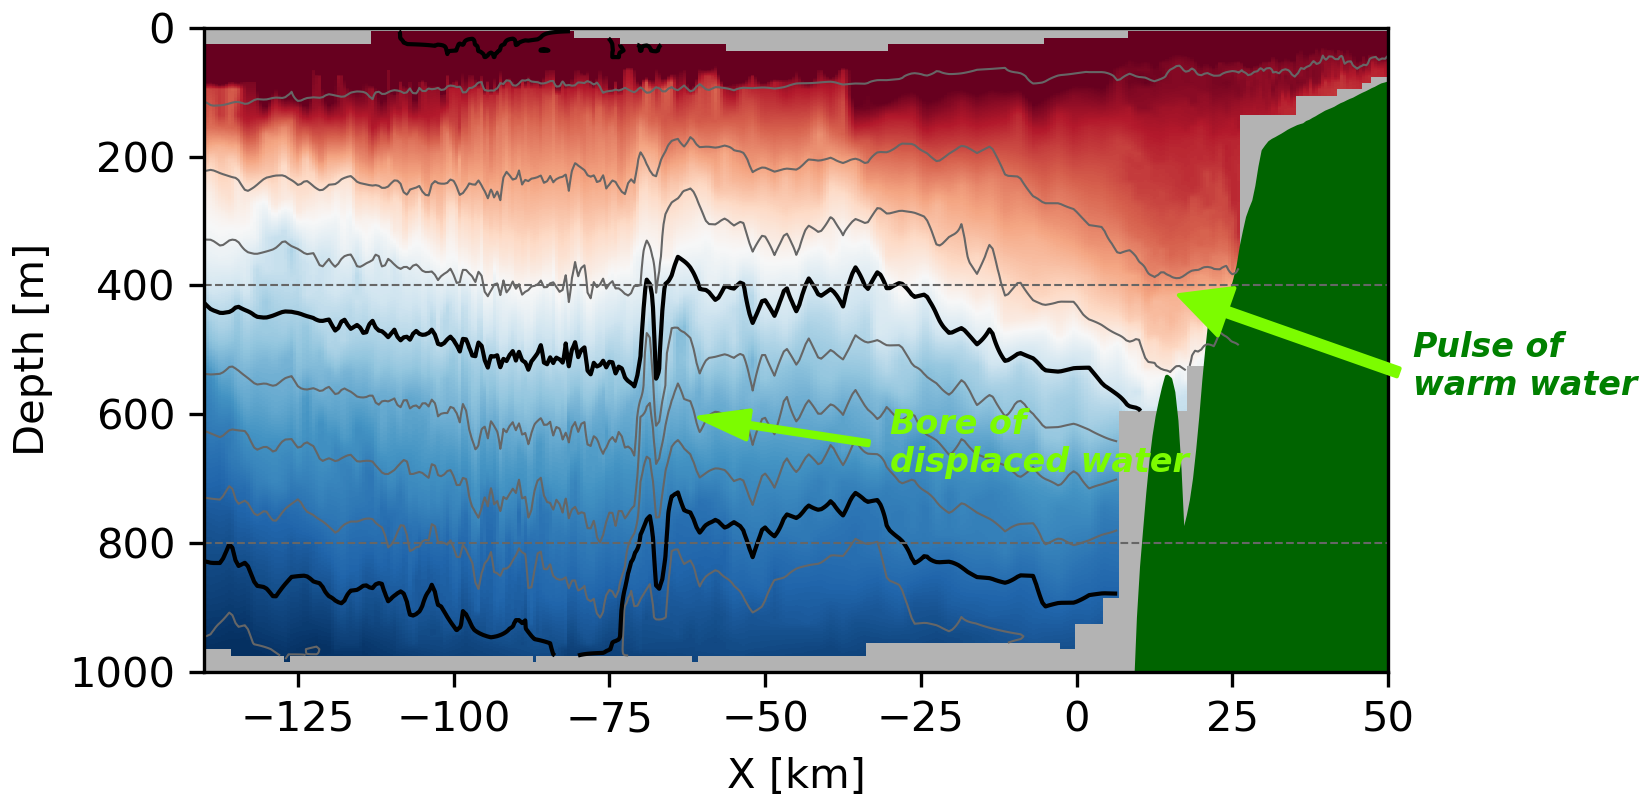
El Niño involves the eastward movement of warm water from the western equatorial Pacific toward the Americas. On reaching the coast, the oceanic signal propagates north and south as coastally trapped waves, often called Kelvin waves. These waves raise sea level and can carry warm water north along the BC coast. The equatorial water itself does not reach BC; instead, the waves displace coastal water northward by hundreds of kilometers, potentially bringing water from as far south as Northern California.
Satellite observations and numerical predictions indicate that the start of El Niño was about 30 October on the BC coast. The animation below is from GLORYS-12 a model that uses observations to predict the ocean in realtime. You can clearly see the propagation of high water starting around 30 Oct, and moving north. The subsurface temperature at 200 m also shows water being pushed north along the wave.
Seeing the El Niño with underwater robots
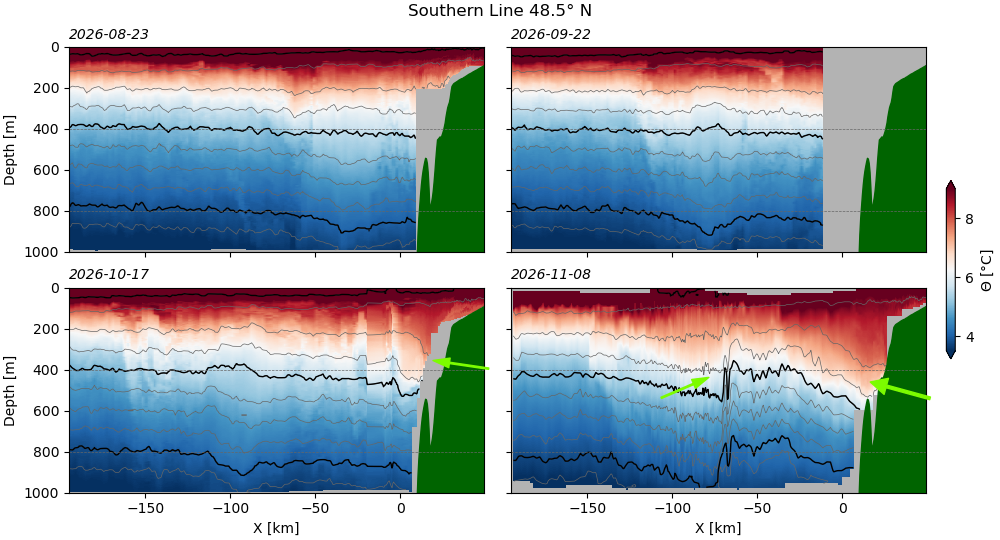
C-PROOF underwater gliders have been observing these changes underwater, a crucial way to verify the model predictions, and to better understand the structure of El Niño under water. Data from our Southern Line (deployed with the help of Bamfield Marine Sciences Centre) show the very large changes. The Aug and Sep data are relatively benign. We can start to see evidence of El Niño in the October 17 data, with surfaces of constant density (the contours) being pushed down almost 100 m. This is the underwater response to the sea-level rising at the coast. The next glider occupation (Nov 8) shows an even stronger response, with constant density being pushed down almost 200 m and warm water extending up the continental slope.
An interesting feature is also seen offshore at about -60 km, where there is evidence of a bore of water pushed offshore as water is displaced by the El Niño signal along the coast. The very sharp undulating interface is at this location indicates very energetic underwater waves, and probably mixing of the water carried by El Niño. C-PROOF is following this feature closely with our gliders.
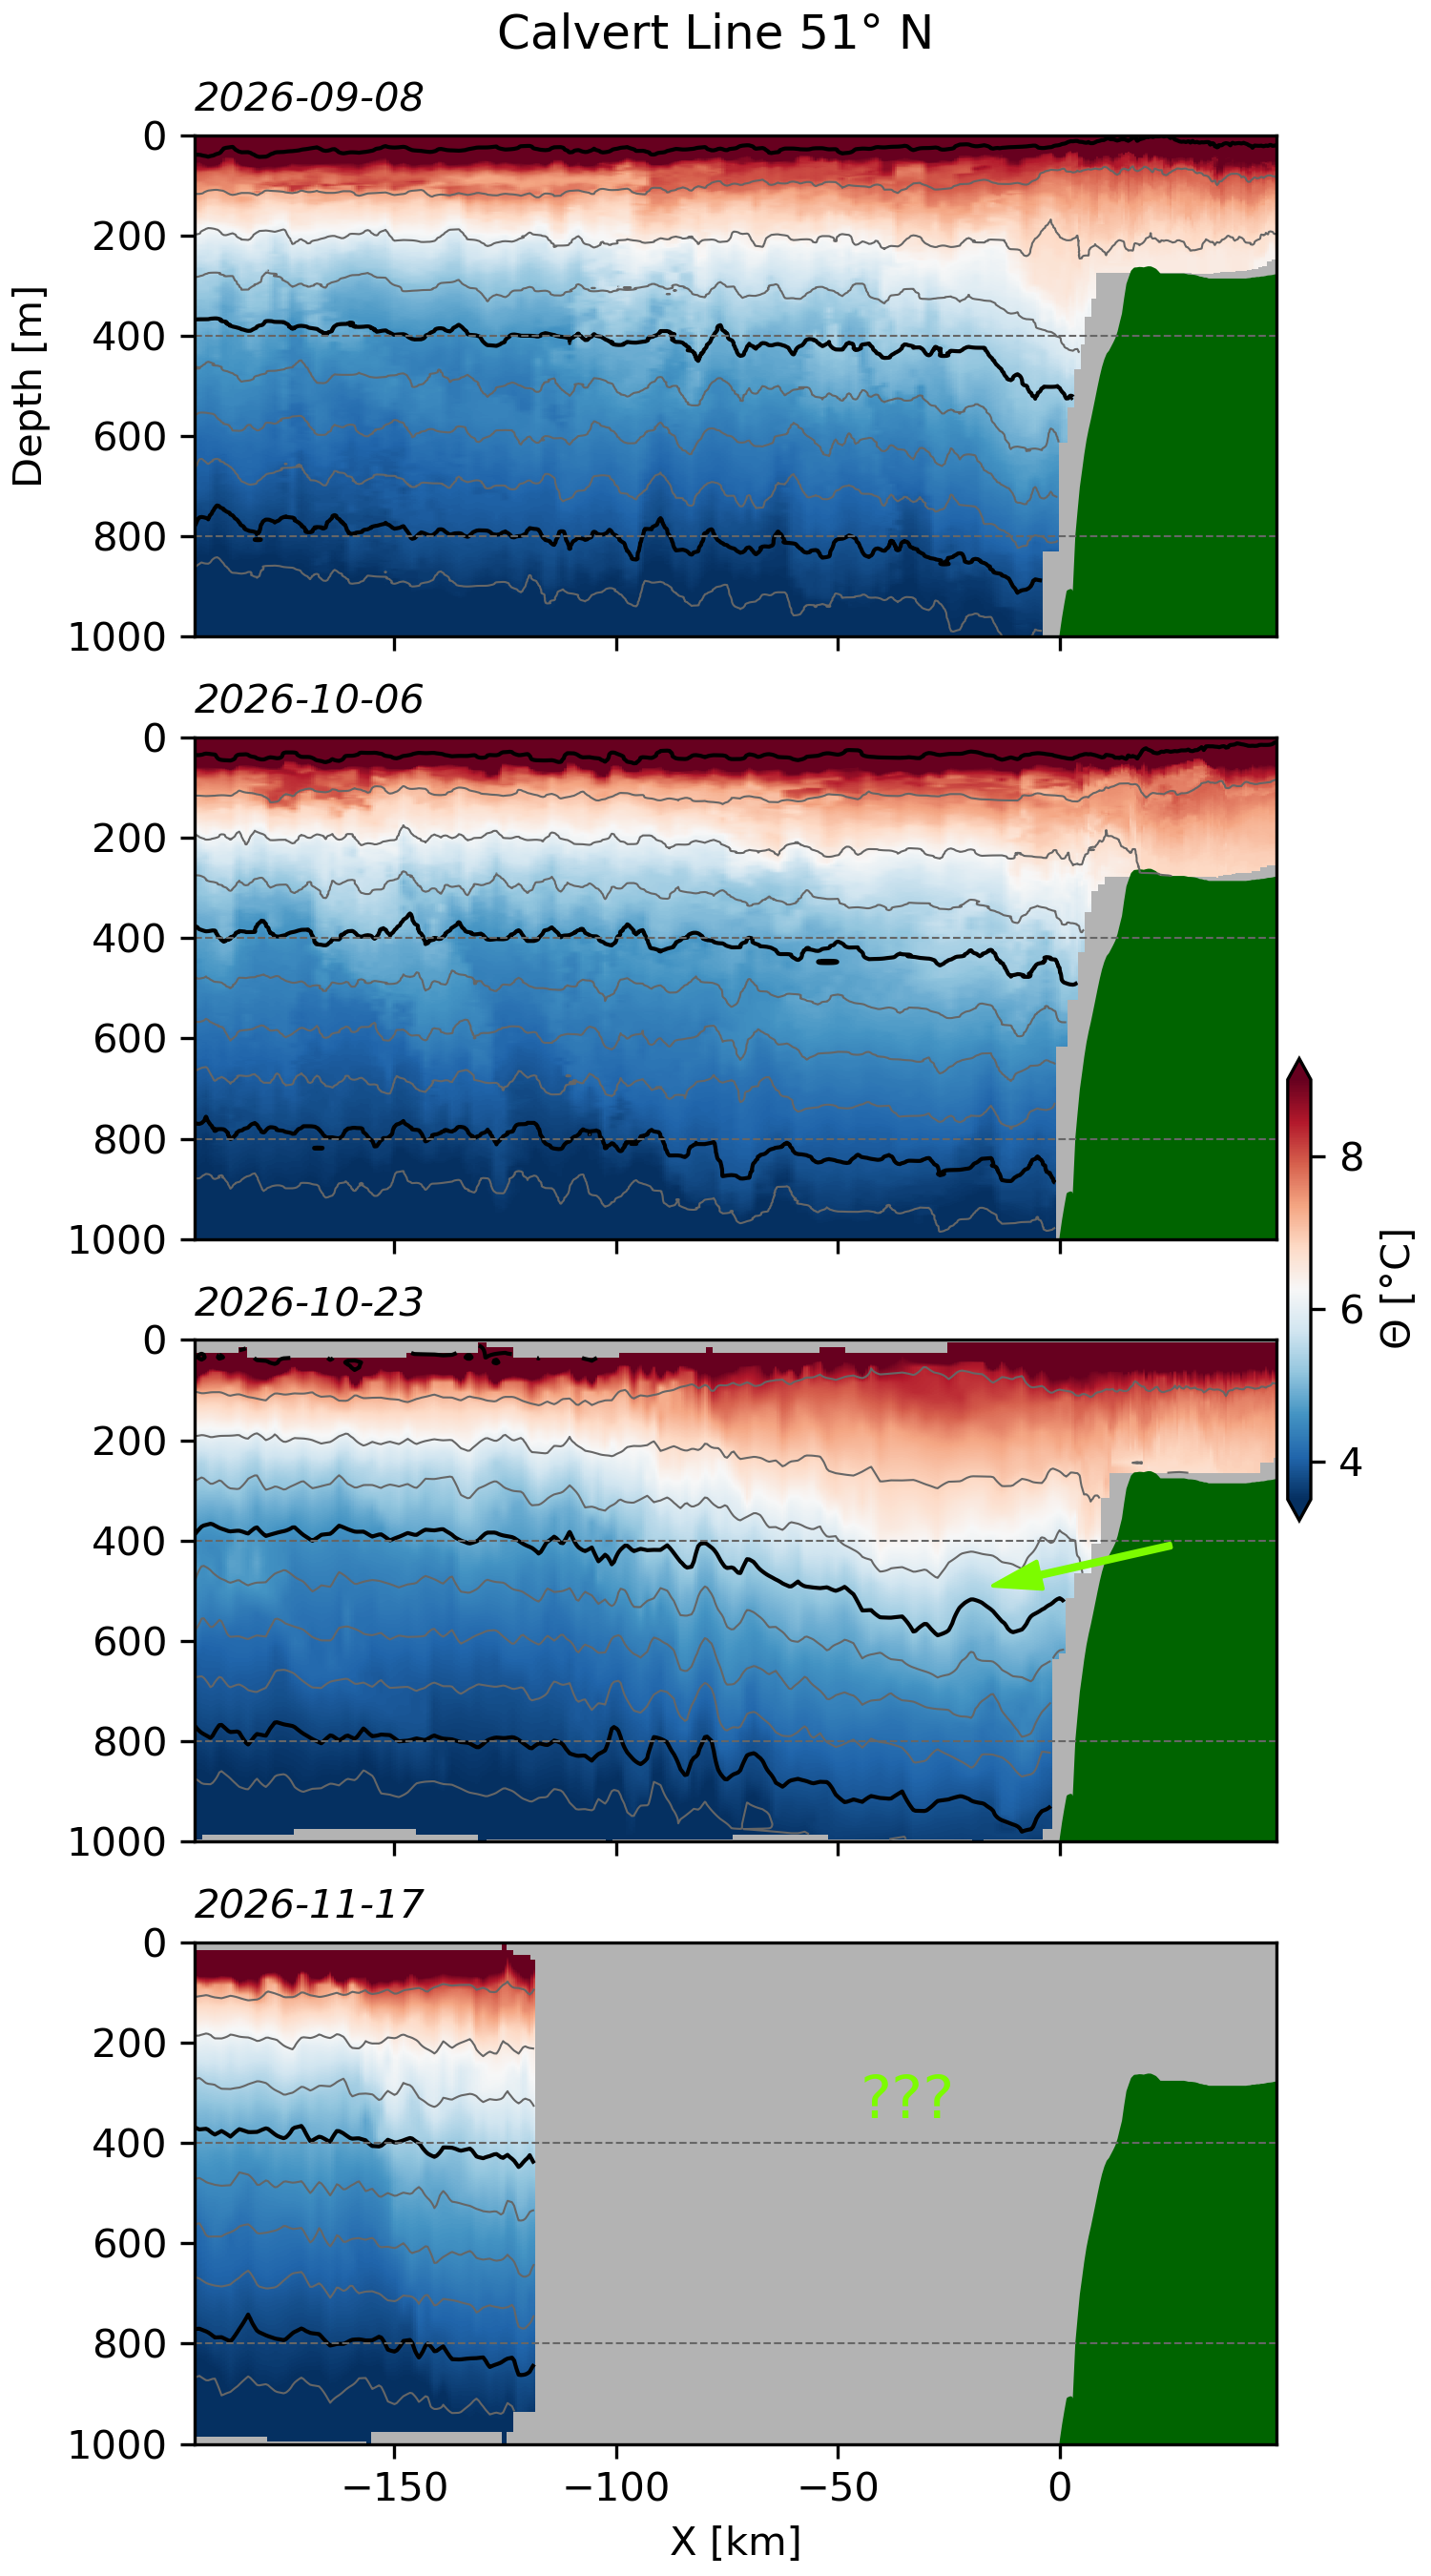
Data from our Calvert Line (deployed with partners at Hakai Institute) also are perhaps showing the start of El Niño, with the constant density surfaces dipping down in the October 23 pass. The glider dfo-maria997 is on its way back to shore now and we are eagerly following what it sees over the next few days; track Maria here.
Is this really anomalous?
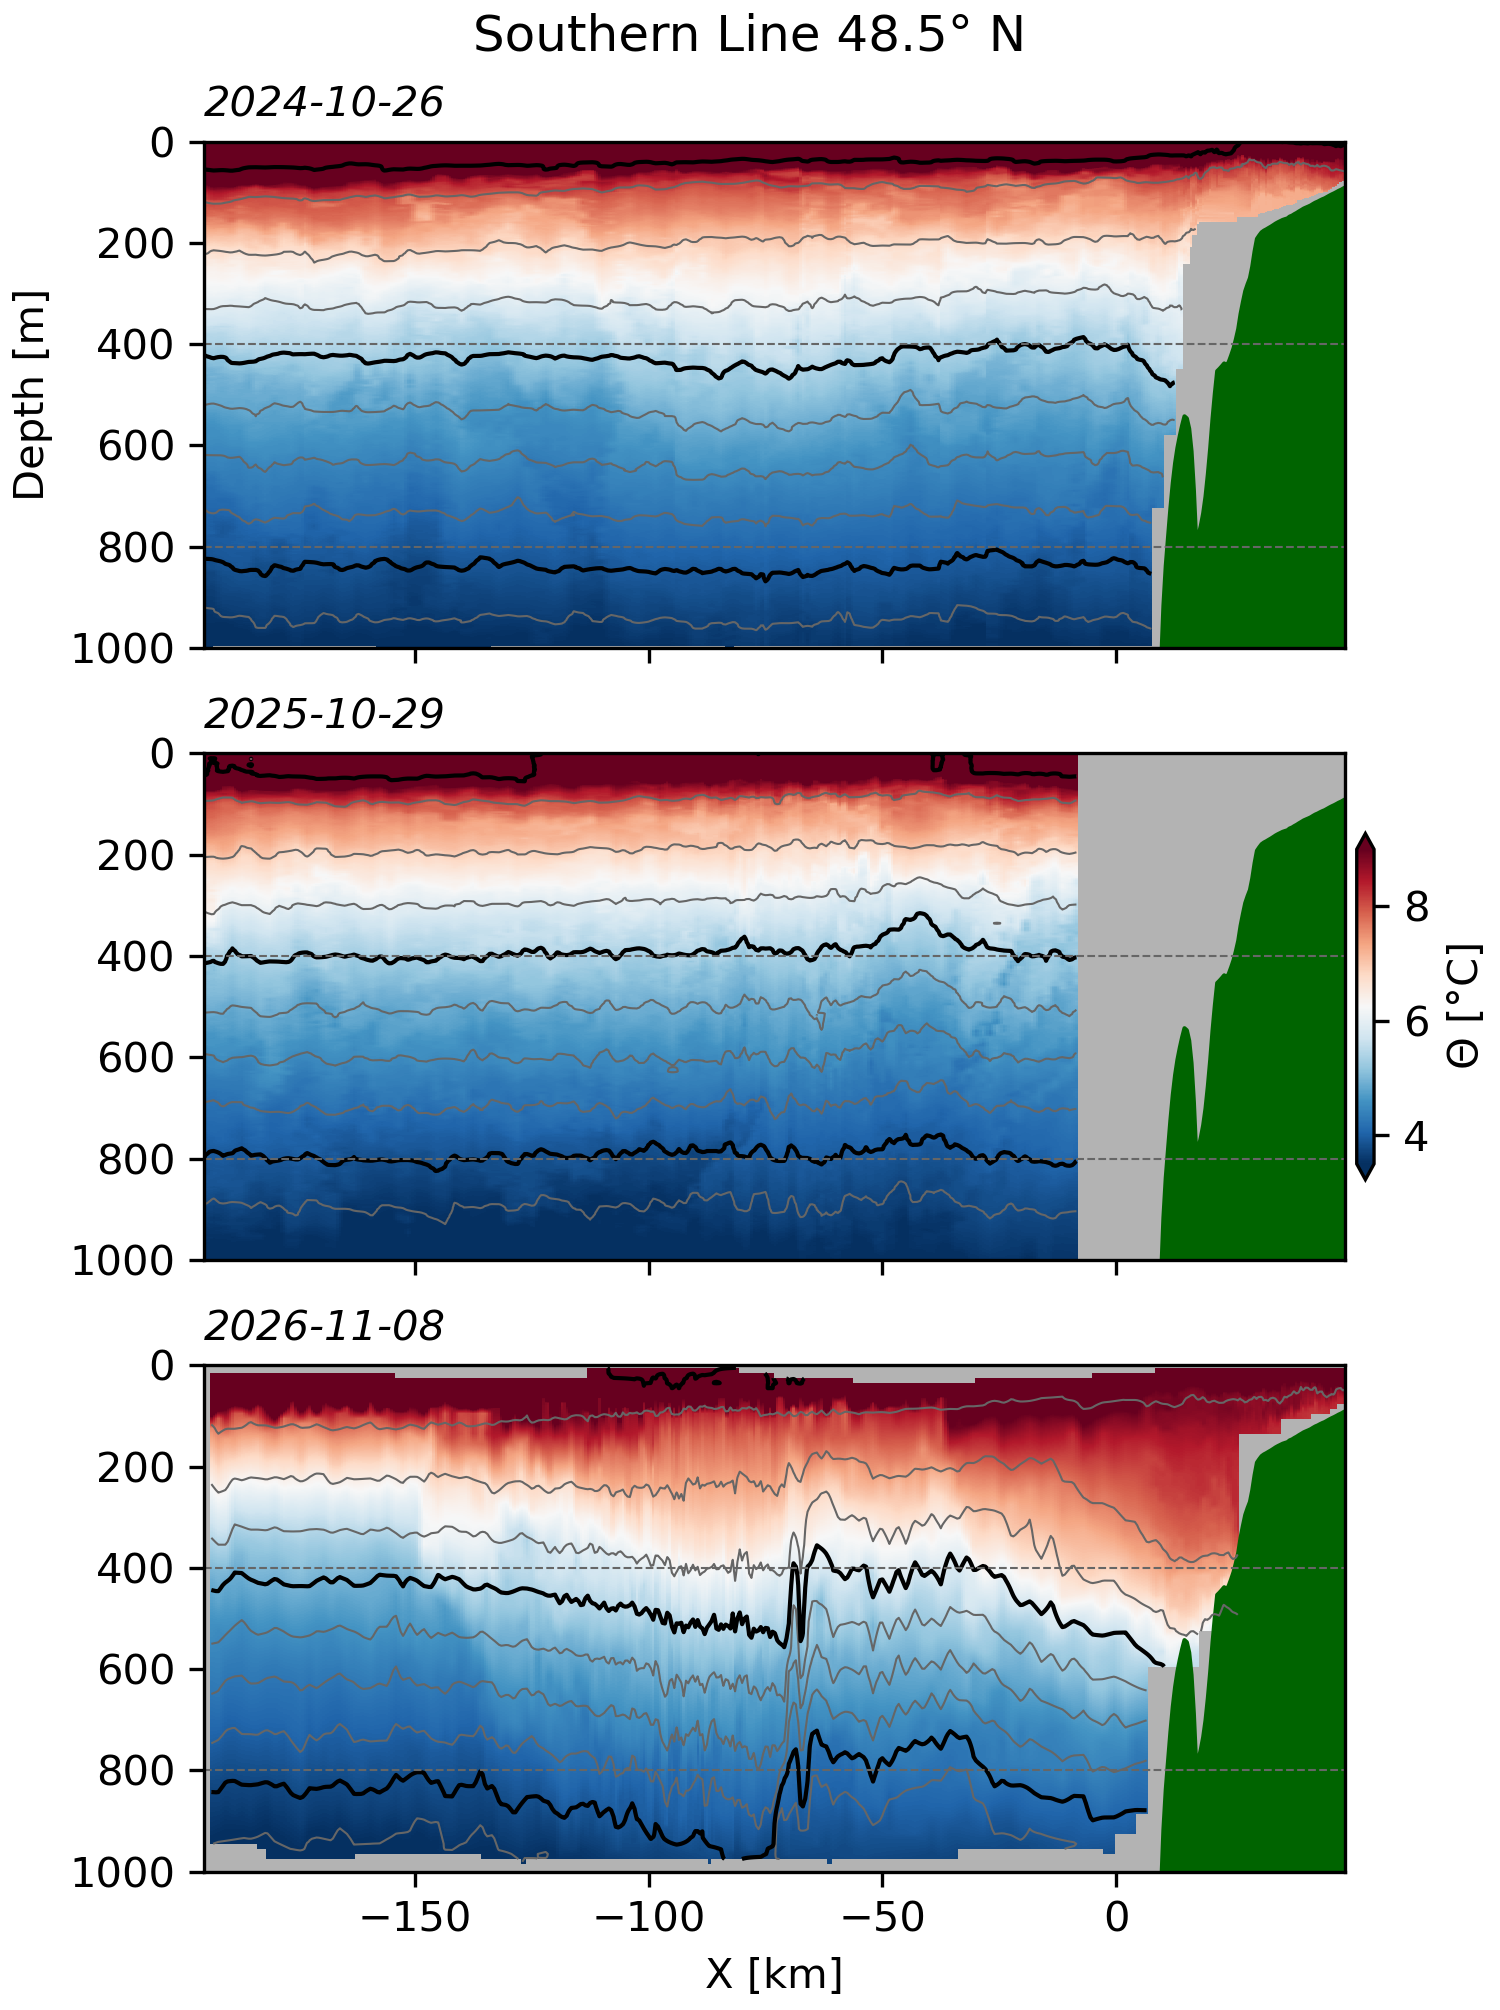
Of course a skeptical reader should ask if this data is really that anomalous? Note this is also the time of year that we expect winds to shift and for the coast to see coastal downwelling, a phenomenon that also raises sea level at the coast and pushes constant density surfaces downwards. So we need to consider whether what we are seeing is just the normal seasonal response, or if it is indeed the signature of El Niño.
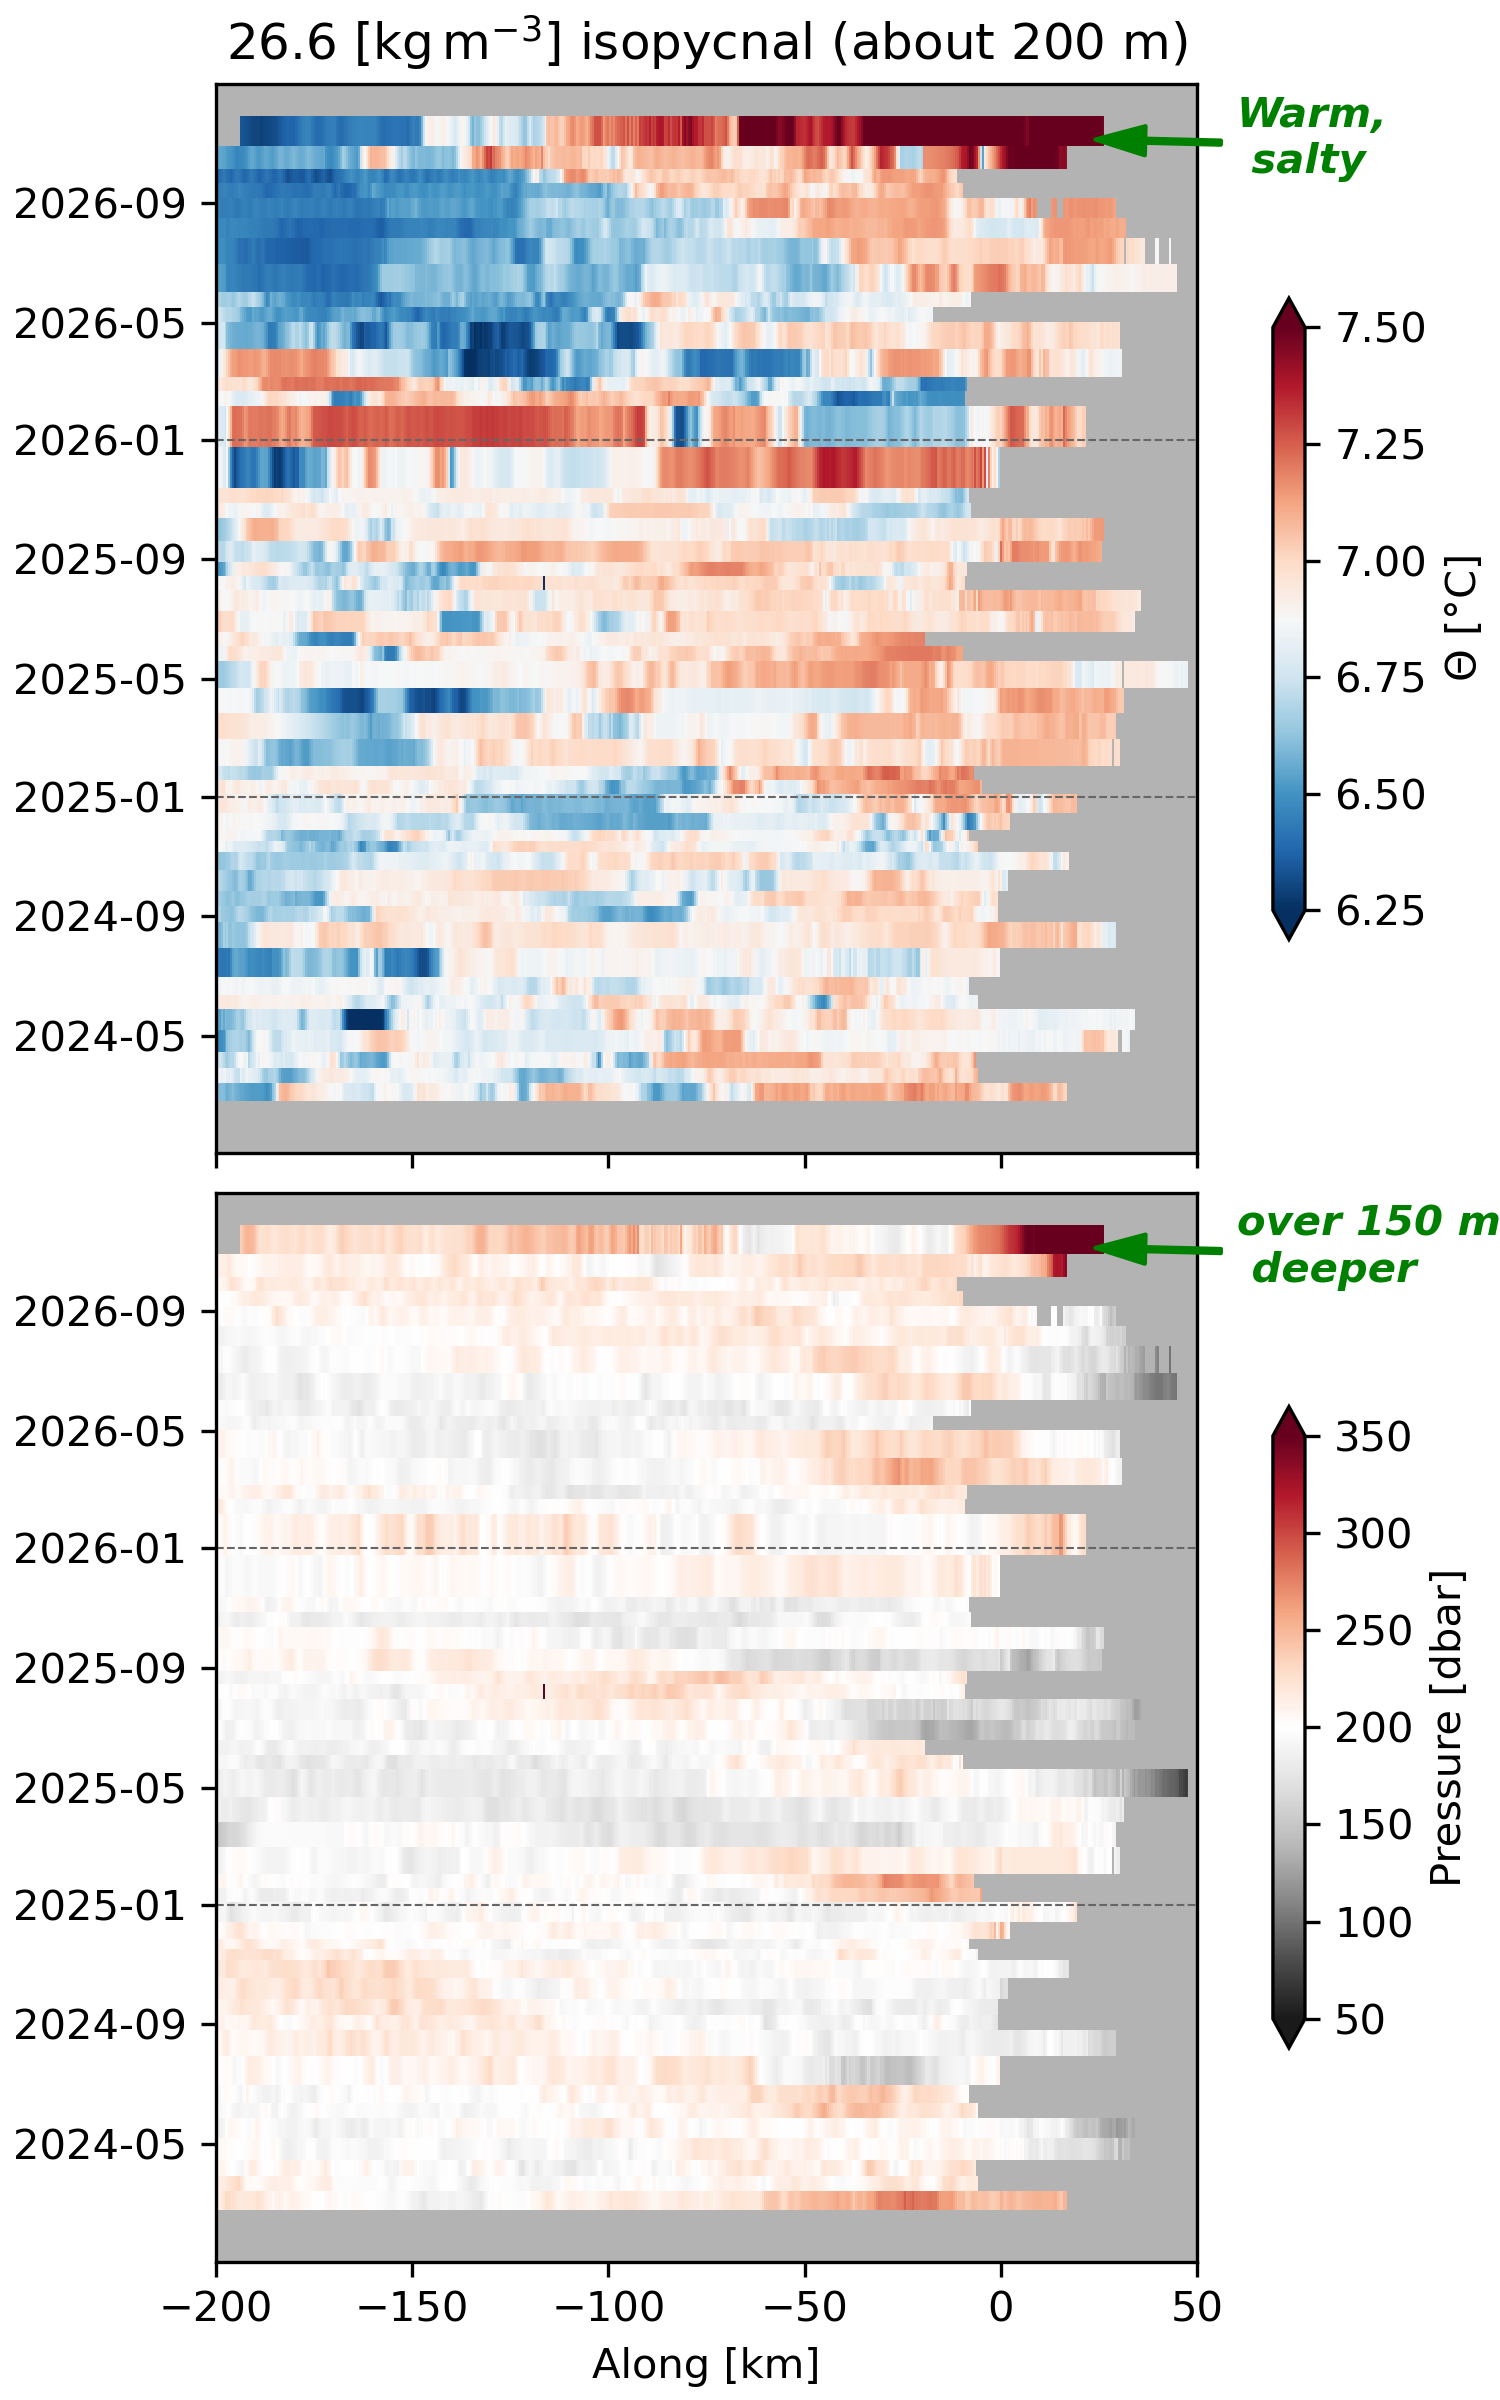
Indeed these are the largest changes we have seen in the Southern Line since we started in Feb 2024. Looking at previous Octobers, we see that this response is particularly strong compared to previous years.
The water along a given constant density surface is also anomalously warm and salty, indicating that water has been brought from further south along the coast, consistent with the expected signature of an El Niño event. We see this with what is called a “Hovmoller” diagram, which shows the evolution of temperature on the 200-m isopycnal over time. We can see that the water on this density surface is over 1 degree warmer than normal and over 100 m deeper than normal (bottom plot). Warmer means that the isopycnals is also saltier and water on it is almost certainly from further south.
Conclusion and outlook
Some of this data is preliminary and subject to revision. However, the broad patterns seem robust that there has been a significant warming and deepening of the constant density surfaces along the Southern Line, consistent with the expected signature of an El Niño event, and the beginning of such a phenomena seen further to the north on the Calvert Line.
What do we expect to happen going forward? El Niño is a large disturbance and should last for a few of months. The sea surface height anomaly at the equator is still quite high, and the wave takes about 2 months to reach the coast of British Columbia. It will be interesting to see the changes as El Niño continues, and then what happens with it relaxes. Its important to note that these changes are not just caused by the Kelvin wave, but will be accompanied by changes in winds and weather systems that will further perturb the ocean and coastal conditions.
We will be working with the west coast community, including other glider observatories to the south, to see how this event unfolds and affects coastal ocean conditions along the west coast of North America.
Links:
- Dillon Amaya’s Coastally Trapped Wave page
- NOAA El Niño page
- DFO El Niño page
- Ocean Networks Canada: Record high ocean temperatures off BC coast